 Activity 6: Mapping Seed Sources
Overview
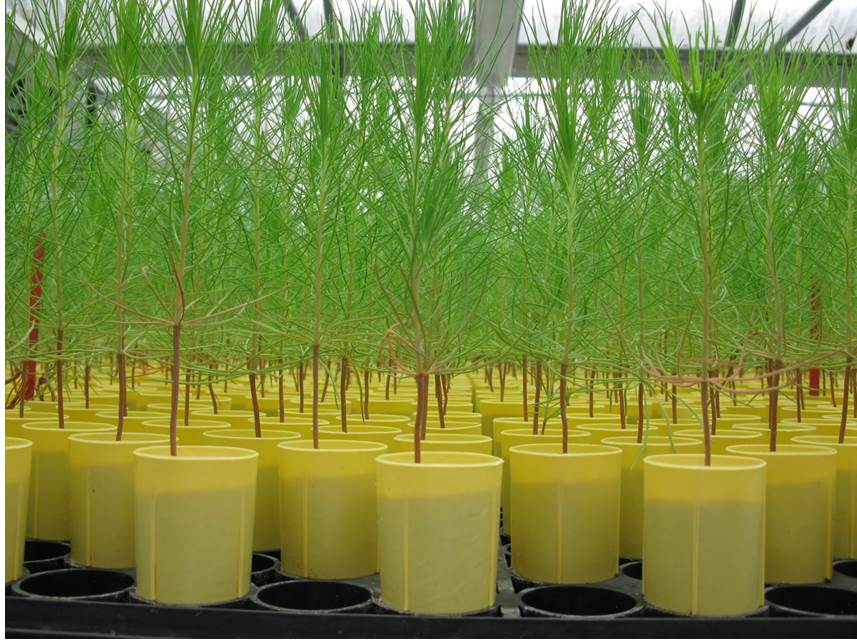
This activity introduces students to ongoing research into the genetics of loblolly pine. Because of variation between the eastern and western populations of native loblolly pines and the environments in which they grow, some families of pine grow faster than others and some resist drought better. Students are asked to graph survival and height data from six different families on three sites to determine which traits are associated with which population. Based on what they learn about forest genetics, students can project where trees with certain characteristics are likely to thrive in changing climatic conditions.
Downloads
Full Activity (with student pages included)
Student Page
- Forest Growth and Rainfall Data Student Page
- Forest Growth and Rainfall Data Student Page (English Unit)
- Creating Column Graphs in Excel Student Handout
Presentations
- Creating Column Graphs in Excel presentation
- Creating Column Graphs in Excel notes
- Introduction to Southeastern Forests Presentation
- Introduction to Southeastern Forests Teacher Notes
- Enrichment Exercise: Calculating Coefficient of Determination presentation
- Enrichment Exercise: Calculating Coefficient of Determination notes
Answer Key
Links
- Climate Change Tree Atlas – Searchable database with information on current distribution and future suitable habitat for 134 common trees in the eastern U.S.
- Southern Pine Seed Sources – Report providing guidance on selection of seed sources for six species of southern pine trees.
- TACCIMO – Web-based tool providing the most current climate change projections and research in an effort to link science to forest management and planning.
- Trees Grow throughout Southeast with Help of UF – Short video introducing the work of the Cooperative Forest Genetics Research Program at the University of Florida.
- Nature and Nurture: Genetics and Climate Influence the Timing of Flowering Trees – A model to predict predict how future changes in temperature could influence flowering times across the range of Douglas-fir under different climate predictions.
![]()
Teacher Comments
I went over some of the graphing basics and assigned this activity as homework. We discussed it the next day. Students were able to extrapolate the data needed and to interpret their graphs.
We used our laptops to develop the graphs. Prior knowledge of the software will be needed for the teacher and the students. We took a couple days just getting a handle on our spreadsheet program. Once we had that under control, we moved quickly to the questions and answered the problem.
I had the students graph their data on large Post-it® note graph paper to make it more interesting to them and to showcase the data better when we analyzed it as a class.
Teacher Tools


